

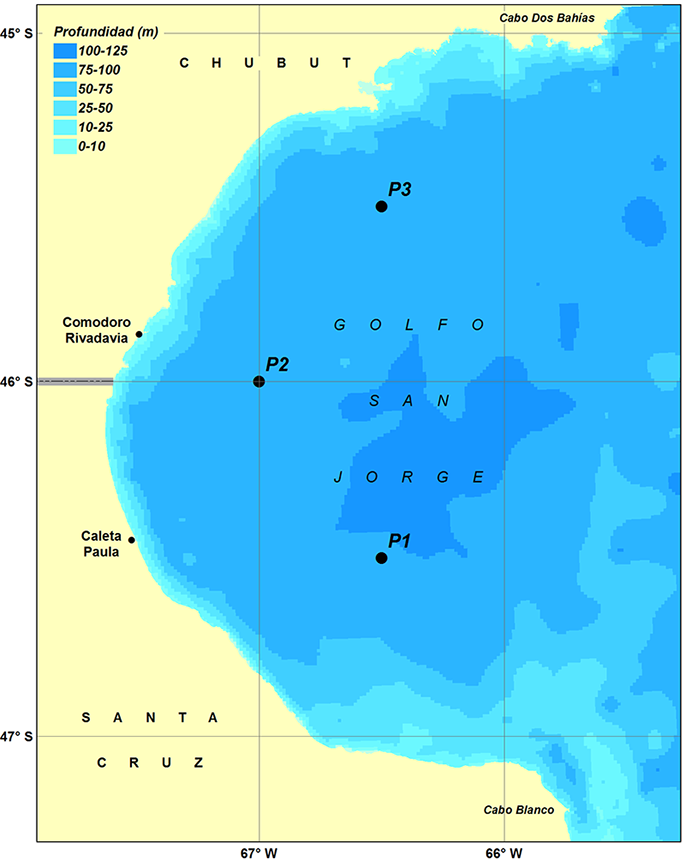
In order to obtain the Tidal levels and currents Forecast for the points P1, P2 and P3 you must click the relevant point on Figure 1
Figure 1. Tidal levels and currents Forecast zone bathymetry. Position of the points with data available online.
Product References
- Product: Numerical simulation of the tide levels and currents course at San Jorge Gulf
- Spatial Coverage: San Jorge Gulf (see Figure 1)
- Model: MIKE 3 HD (DHI) references in www.dhigroup.com (Licensed to Ezcurra & Schmidt SA)
- Time frame: 2 months minimum from current date
- Calculus Nodes: 225 x 265
- Distance between calculus nodes: 1000 m
- Point available online:
- P1: 66º 30’ W – 46º 30’ S (local depth = 97 m at MSL*)
- P2: 67º 00’ W – 46º 00’ S (local depth = 91 m at MSL*)
- P3: 66º 30’ W – 45º 30’ S (local depth = 93 m at MSL*)
- Time and date reference: UTC-3 (dd/mm/yyyy hh:mm)
- Data: Tidal levels and velocities at 10 m below MSL*
- Sea levels reference: MSL* in meters
- Currents velocity units: m/s
- Currents direction units: degrees to where the current is headed, 0 represents north and increases clockwise
* MSL = mean sea level
The Tidal levels and currents Forecast is currently in trials and revision mode. Please send your comments to: gdanieli@essa.com.ar
Model Validation
A validation of the simulations was made based on the SHN prediction of sea levels in Comodoro Rivadavia and Caleta Paula. Figures 2 and 3 present the comparison between the Tide Charts and MIKE 3 HD for February 2016.
Figure 2. Comparison between SHN high and low tides and MIKE 3 HD Tide Tables for February 2016 in Comodoro Rivadavia (Chubut).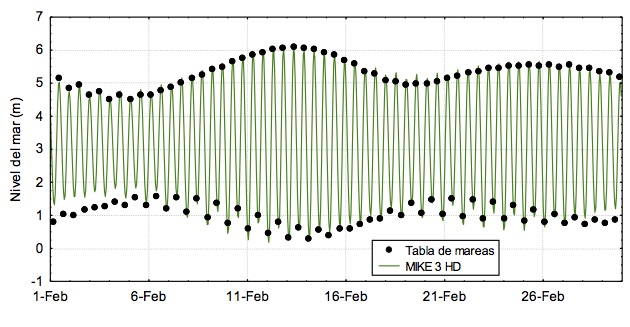
Figure 3. Comparison between SHN high and low tides and MIKE 3 HD Tide Tables for February 2016 in Caleta Paula (Santa Cruz).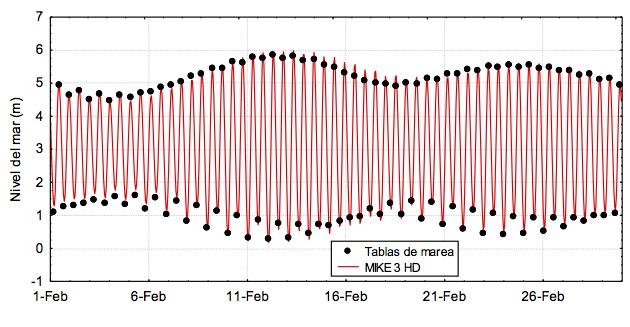
Results
In order to illustrate the results of the model, Figures 3 and 4 are presented with 2 different conditions of the currents field in the simulated zone.
Figure 4. Bathymetry (in colors) and currents field (in vectors) in San Jorge Gulf, speeds in rising tide conditions. Note: The number of vectors shown correspond to 1 in 6 both in rows and columns, so that currents can be better appreciated.
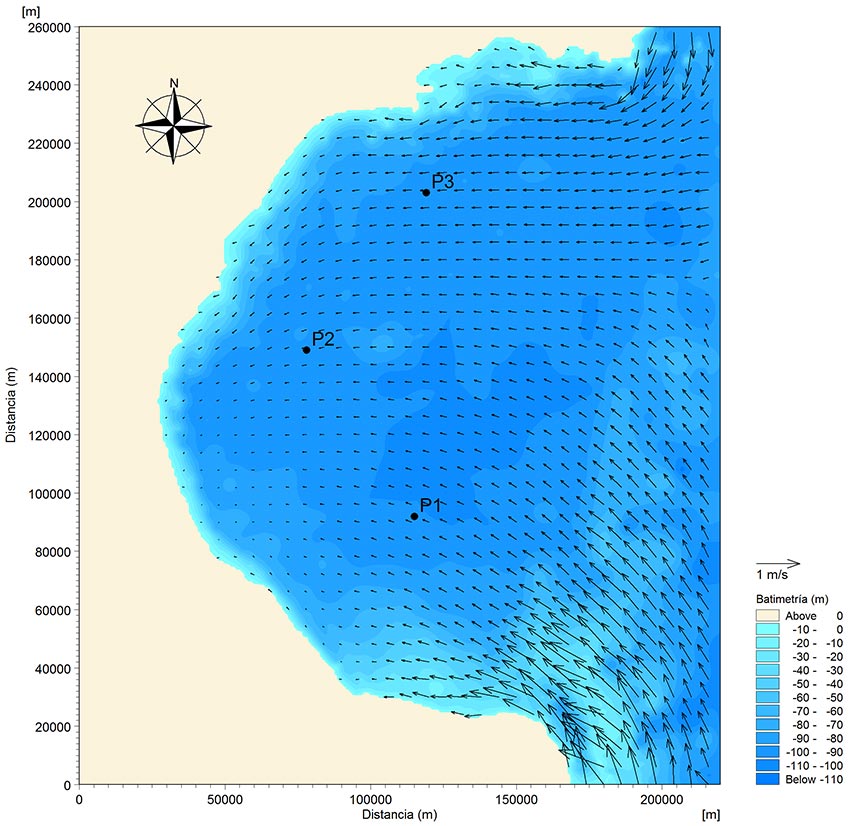
Figure 5. Bathymetry (in colors) and currents field (in vectors) in San Jorge Gulf, speeds in falling tide conditions. Note: The number of vectors shown correspond to 1 in 6 both in rows and columns, so that currents can be better appreciated.
